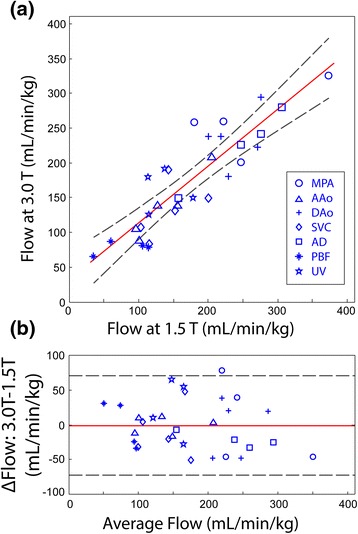
Figure 1.

Comparison of foetal flows measured at 3.0T versus 1.5T using PC CMR with MOG. (a) Comparison of foetal flows measured at 3.0 T versus 1.5 T using PC CMR with metric optimized gating. Symbols = vessel type (see legend); Solid red line = linear regression; Dashed lines = 95% confidence limits (b) Bland-Altman analysis of data from (a). Solid red line = mean; Dashed = 95% confidence limits.
