
Figure 3.
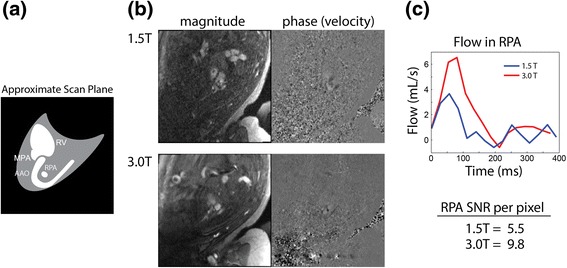
Comparison of PC CMR of the RPA at 1.5 T and 3.0 T. (a) Diagram of slice orientation through the foetal anatomy showing major vascular landmarks. (b) Magnitude and phase (velocity) data at 1.5 and 3.0 T, demonstrating superior SNR and anatomical visualization at 3.0 T. (c) Corresponding flow waveforms obtained from the RPA at 1.5 T (blue) and 3.0 T (red), and mean SNR (per pixel) for the RPA. RV = Right ventricle.