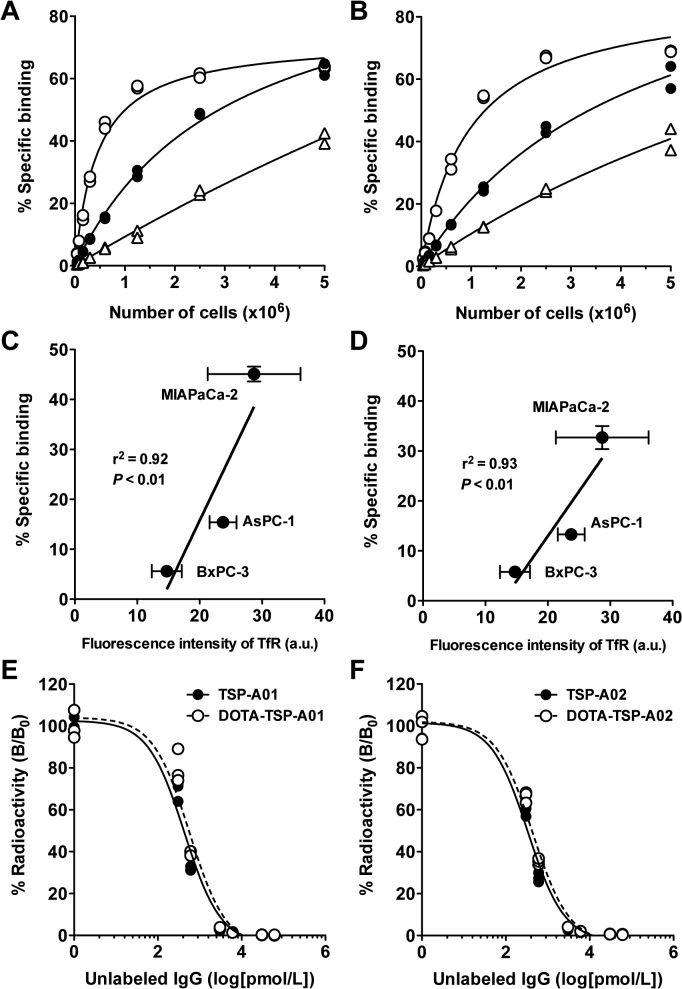
Fig 2. In vitro characterization of 111In-TSP-A01 and 111In-TSP-A02.
Cell binding assay of 111In-TSP-A01 (A) and 111In-TSP-A02 (B) to AsPC-1 (black circles), BxPC-3 (white triangles), and MIAPaCa-2 cells (white circles). Correlation analysis of cell binding at 6.25 × 10⁵ cells with TfR protein expression for 111In-TSP-A01 (C) and 111In-TSP-A02 (D). The a.u. means arbitrary unit. Competitive inhibition assay for TSP-A01 (E) and TSP-A02 (F) using the corresponding intact (black circles, solid line) and DOTA-conjugated (white circles, dashed line) antibodies.

