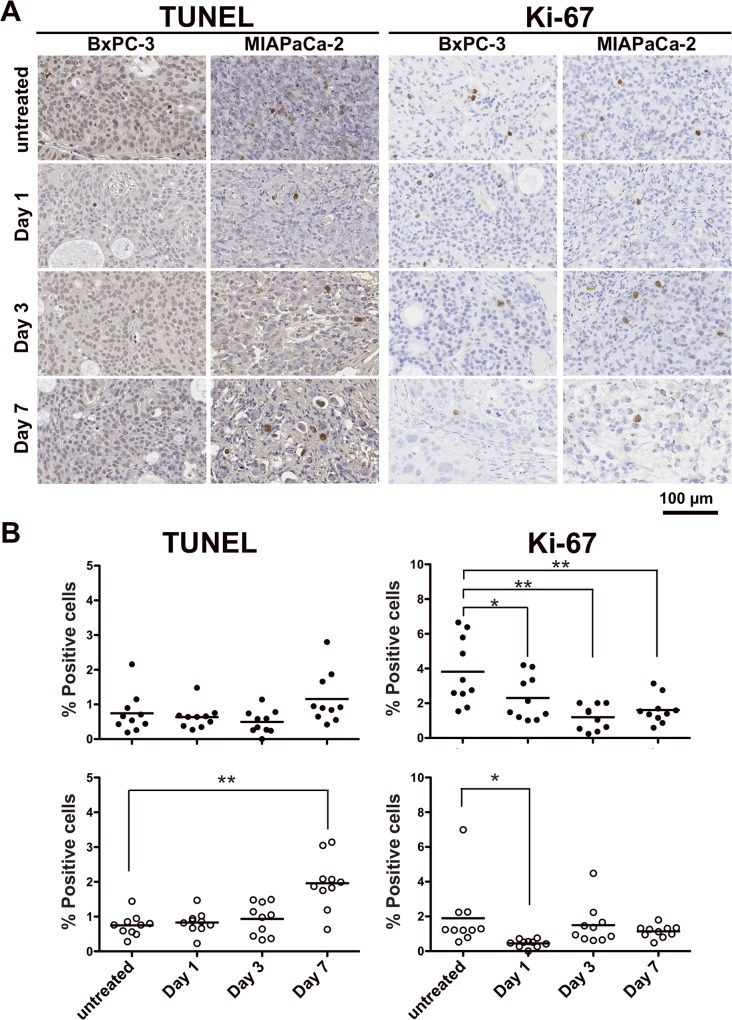
Fig 6. Immunohistological analysis of tumors with 90Y-TSP-A01 treatment.
(A) TUNEL- (left side panels) and Ki-67-stained (right side panels) tumor sections at days 1, 3, and 7 after injection of 3.7-MBq 90Y-TSP-A01. (B) Scatter plots of positive cells in tumors treated with 90Y-TSP-A01 in BxPC-3 (black circles, upper panel) and MIAPaCa-2 tumors (white circles, lower panel). Bars indicate the mean. *P < 0.05, **P < 0.01 (vs. untreated).

