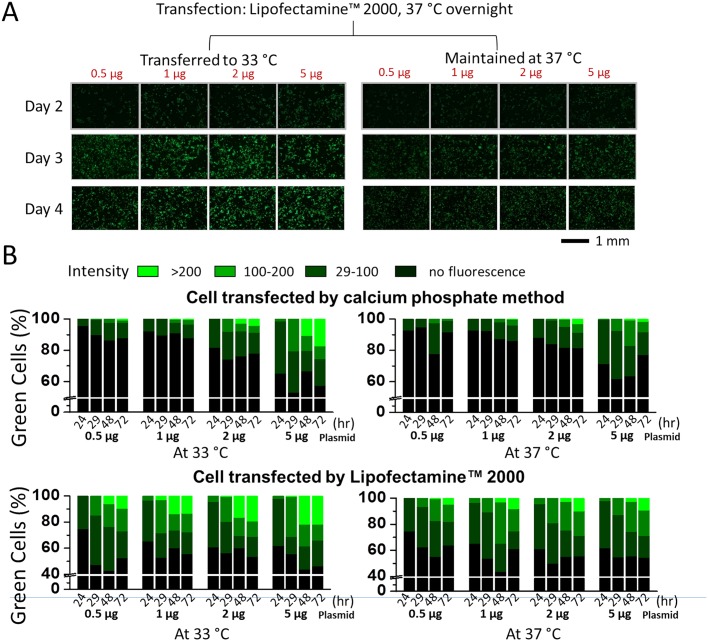
Fig 3. Comparison of different transfection methods and the amount of the GFP plasmid used for transfection.
(A) Enhancement of GFP expression in HEK-293S cells that grew at 33°C (on the left), as compared with 37°C (on the right). HEK-293S cells were transfected with varying amounts of the GFP plasmid, as labeled, using Lipofectamine 2000 or by the calcium phosphate method (photos not shown). A set of dishes (on the left) were transferred to a 33°C incubator, 24 hours after transfection and were maintained at 33°C. Shown are green fluorescence images from day 2 to day 4 (8.7x magnification, 1/5 second exposure time). (B) Percentage of the green cells from each of the dishes with varying amounts of the GFP plasmid and the fluorescence intensity from each of three intensity scales. The upper and lower panels are images from cells transfected using calcium phosphate and Lipofectamine 2000, respectively. The images on the right are controls (at 37°C) whereas the images on the left are cells maintained at 33°C (after overnight culture at 37°C). For determining the percentage of green cells, bright-field images for the same dish were also taken (images not shown). In both cases, 34.8x magnification images were used for data analysis. The white colored line represents the line-break. The green cells were further categorized into three levels of brightness. A typical HEK-293S cell in 34.8x magnification contained 3,000 ± 800 pixels. Based on the green fluorescence image, the pixels from the darkest green cell have an intensity of ≥29. Note the green intensity for each pixel in a JPEG file was recorded in an 8-bit byte, which was converted to a scale from 0 to 255. A cell with the average intensity under 29 indicated no GFP fluorescence, at least not appreciably, which we assigned as black color. A cell with an average brightness between 29 and 100 was labeled low green intensity, colored as dark green bar. A cell with an average brightness between 100 and 200 was considered medium intensity, colored as green. Bright green was the color used to label any cell with an average brightness between 200 and 255. The percentage of each green group was calculated based on the total cell count, and the total number of cells was determined from the bright-field view of the same viewing area (images not shown).

