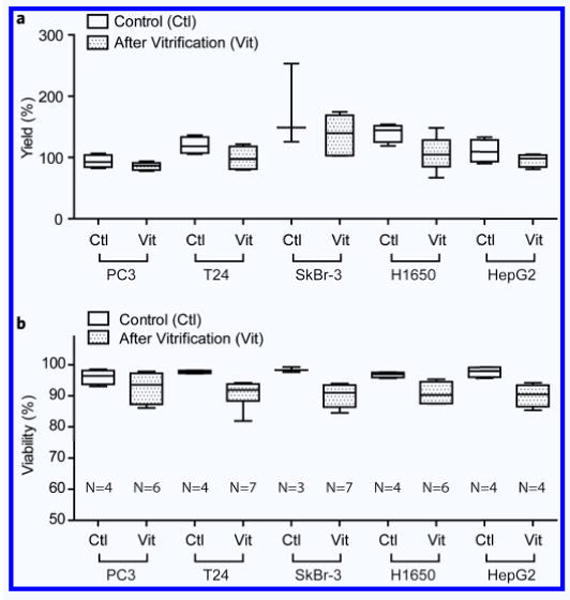
Figure 3.

Yields and viability. (a) Yields of the loaded cell after vitrification. Yields were obtained by comparing the dispensed cell numbers with the calculated loaded cell numbers. (b) Viability of different cell types after vitrification using 200 μm(ϕ)−20 μm(t) fused silica capillary.
