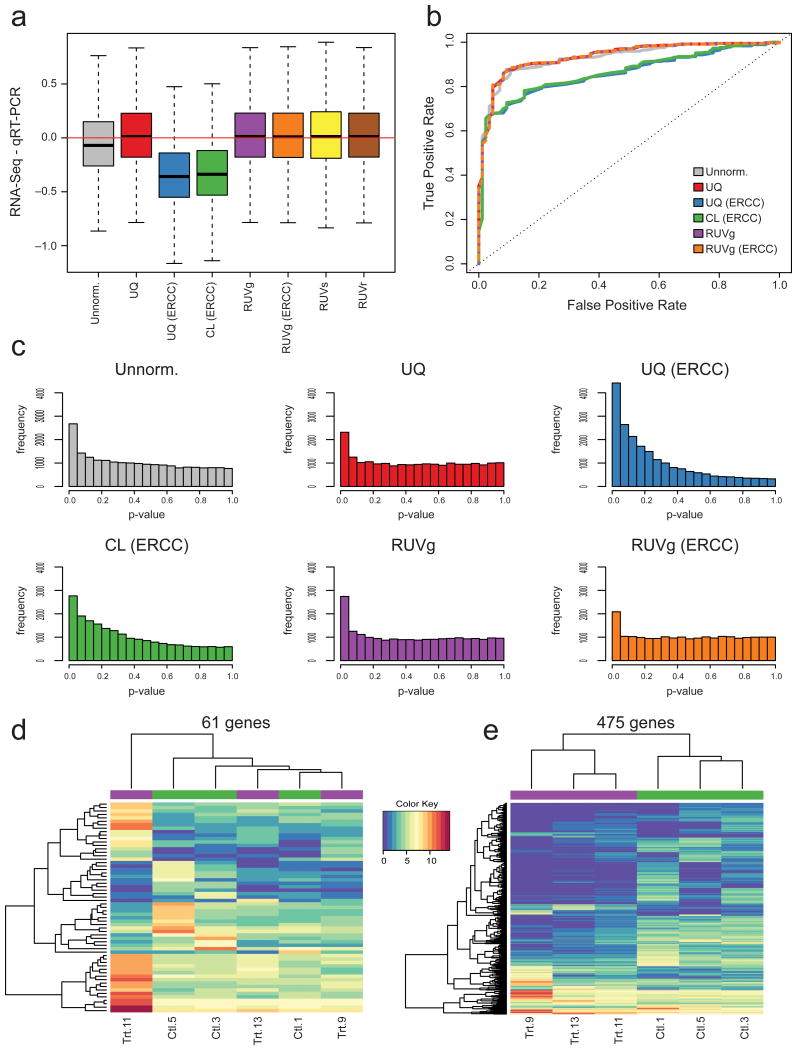
Figure 6.
Impact of normalization on differential expression analysis. (a) For SEQC dataset, difference between RNA-seq and qRT-PCR estimates of Sample A/Sample B log-fold-changes, i.e., bias in RNA-seq when viewing qRT-PCR as gold standard. All RUV versions lead to unbiased log-fold-change estimates; CL based on ERCC spike-ins leads to severe bias. (b) For SEQC dataset, receiver operating characteristic (ROC) curves using a set of 370 positive and 86 negative qRT-PCR controls as gold standard. RUVg (based on either empirical or spike-in controls) and UQ normalization perform slightly better than no normalization. UQ based on spike-ins performs similarly to no normalization and CL based on spike-ins performs the worst. (c) For Zebrafish dataset, distribution of edgeR p-values for tests of DE between treated and control samples. UQ and CL normalization based on spike-ins lead to distributions far from the expected uniform. (d) For Zebrafish dataset, heatmap of expression measures for the 61 genes found DE between control (Ctl) and treated (Trt) samples after UQ but not after RUVg normalization. Clustering of samples is driven by outlying Library 11. (e) Heatmap of expression measures for the 475 genes found DE after RUVg but not after UQ normalization. Samples cluster as expected by treatment.

