Fig. 2.
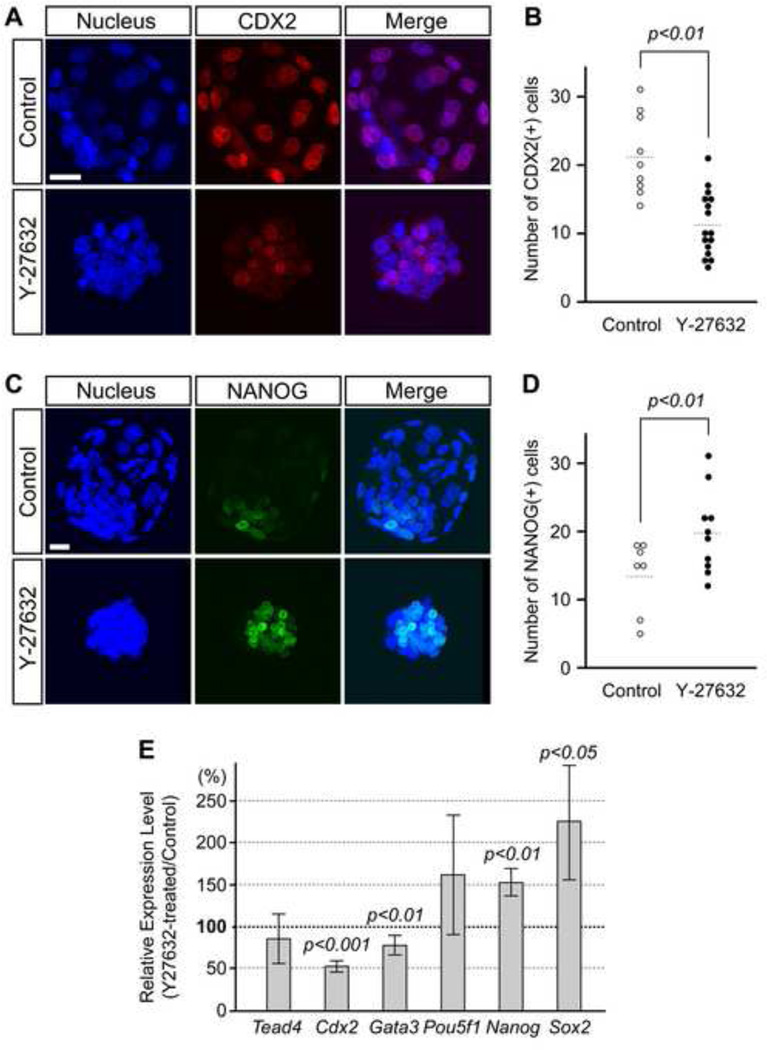
Inhibition of ROCK activity promotes ICM and diminishes TE gene expressions. Embryos were cultured in the absence (control) or presence of Y-27632 from 2-cell to blastocyst stage (E1.5-E4.5). (A) Distribution of the TE lineage marker, CDX2 (red), in representative control and treated embryos (E4.5). (B) Comparison of the number of CDX2-positive cells. Inhibitor-treated embryos (n=16) have significantly less CDX2-expressing cells (Student t-test) than control embryos (n=9). Circles represent the number of CDX2-positive cells in individual embryos, and horizontal dashed bars represent the mean value for each group. (C) Distribution of the pluripotency marker, NANOG (green), in representative control and treated embryos (E4.5). (D) Comparison of the number of NANOG-positive cells. Inhibitor-treated embryos (n=10) have significantly more NANOG-expressing cells (Student t-test) than control embryos (n=7). Circles represent the number of NANOG-positive cells in individual embryos, and horizontal dashed bars represent the mean value for each group. Images (A, C) are Z-axis projections of optical sections captured by confocal microscopy. Blue, DAPI. Scale bars: 20 µm. (E) Quantitative RT-PCR analyses of Y-27632-treated embryos at the early blastocyst stage (100 h post-hCG). Relative expression levels of Tead4, Cdx2, Gata3, Pou5f1, Nanog, and Sox2 are shown as percentages of their levels in the inhibitor-treated embryos relative to those in control embryos. In each set of experiments, the expression level of each gene is normalized by that of Actb. Bars indicate mean ± standard deviation. P values for Cdx2, Gata3, Nanog, and Sox2 are based on Student t-test, indicating that the change in these genes by Y-27632 treatment is statistically significant.

