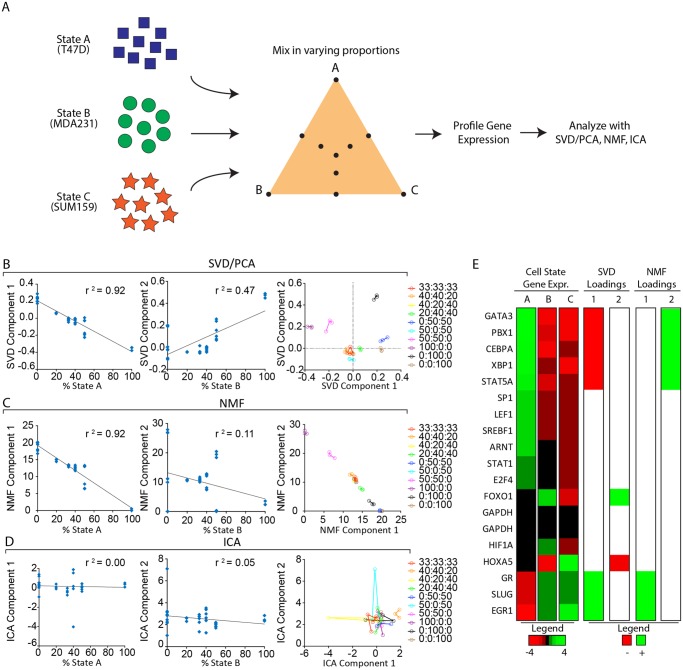
Fig 2. Comparison of SVD/PCA, NMF and ICA in an idealized experiment with defined cell-state proportions.
(A) Three different cell lines T47D, MDA231, and SUM159 representing ‘cell states’ A, B, and C, respectively, were mixed in varying ratios. These heterogeneous mixtures were expression-profiled using qPCR, and SVD/PCA, NMF, and ICA were used to factor the resulting gene-expression matrix. For each heterogeneous population the first and second components obtained by the SVD/PCA (B), NMF (C), and ICA (D) factorization algorithms were plotted against the fraction of cells in State A or B, respectively; the squared correlation coefficient (r 2) is shown for each plot. (B-D, plot on right) For each algorithm the data were plotted in Component 1 vs Component 2 space with the replicates having the same color and connected by lines. (E) Heatmap of gene expression in each of states A, B and C. Data were log-transformed and mean-normalized by row; a red/green color scale is shown. Also shown are the genes with the highest loadings, both positive (green) and negative (red), in the first two components identified by the SVD and NMF factorizations. The heatmap shows that SVD component 1 identified genes strongly up or down in state A, while SVD component 2 found the two genes strongly differentially expressed between states B and C. In contrast, both NMF components 1 and 2 identified genes that were unique to state A, being down and up respectively in state A.

