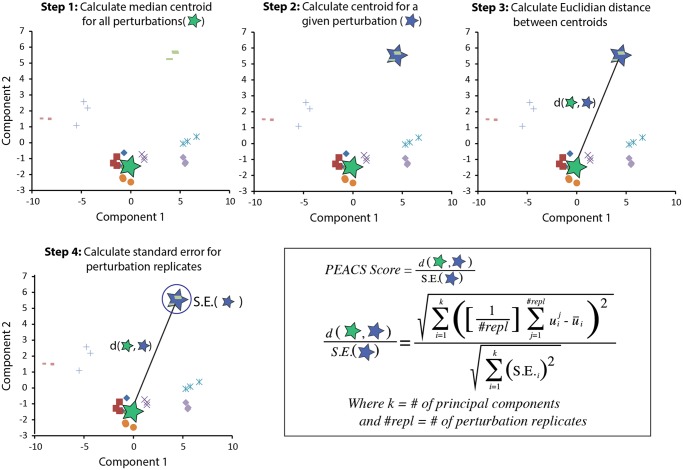
Fig 3. Schematic showing the steps in the calculation of a PEACS score.
Step (1): calculate a median centroid for all perturbations (green star) in a given experiment. Step (2): calculate a centroid of a set of replicates for a single perturbation (blue star). Step (3): calculate the Euclidean distance (d) between the median centroid of all perturbations and the centroid of a set of replicates for a single perturbation. Step (4): calculate the standard error (S.E.) about the mean for a set of replicates for a single perturbation. For each set of perturbation replicates, the PEACS score is defined as the distance calculated in Step 3 divided by the S.E. calculated in Step 4. In the formula shown k is the number of SVD principal components, which is determined by a Scree plot; repl is the number of replicates for a given perturbation; is the coefficient of the ith SVD gene-expression vector for the jth perturbation; and is the average coefficient across all perturbation samples for the ith SVD gene-expression vector.

