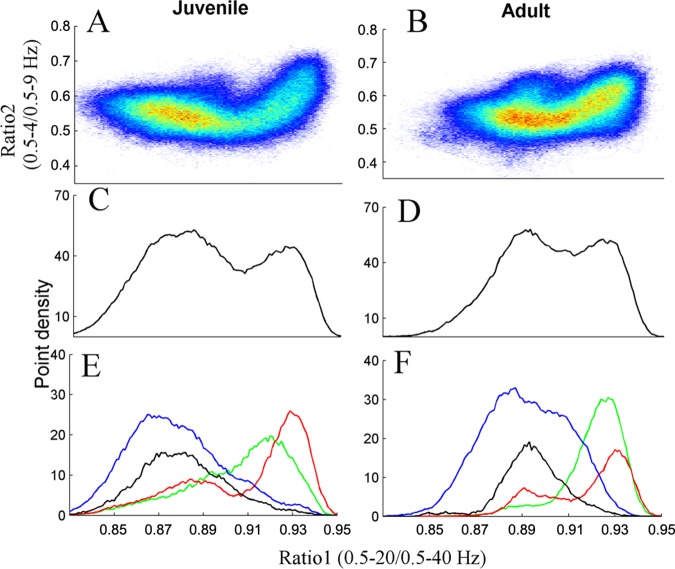
Fig 1. Point densities averaged across all control (A) and UAO (B) animals of the 2D state space plots.
Each plot showed 24 hours of EEG activity, and each point represented 1 second of EEG activity, after application of 20-second wide Hanning window. (C), (D)–“average” state space densities for juvenile and adult animals, projected into ratio 1, respectively. This projection yielded two peaks; left peak was associated with Wake and PS, and the right peak was associated with SWS sleep. (E), (F) Each of the vigilance state space point densities (not shown) was projected separately into ratio 1. Blue—Wake; Black—paradoxical sleep (PS); Green—light slow wave sleep (LSWS); Red—deep SWS (DSWS).

