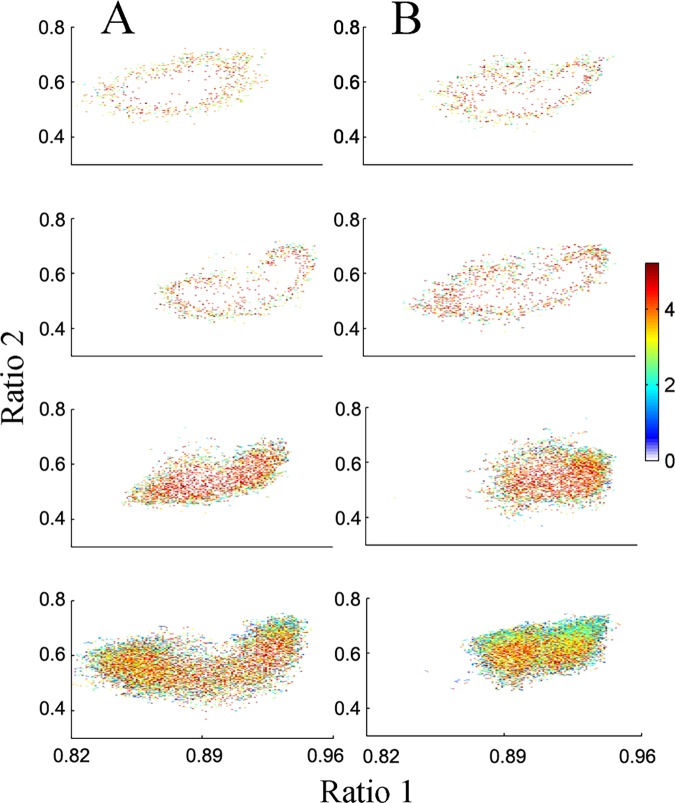
Fig 4. Maturation did not alter velocity.
Velocity is defined as the horizontal and vertical distance between two consecutive points in the point density plot divided by the temporal resolution of 1 second. Plots represent velocities calculated by Pythagorean Theorem for four juvenile (A) and adult (B) animals. Values represent average velocities originating at that site. Warm colors show fast velocities (transition regions) and cool colors slow velocities.

