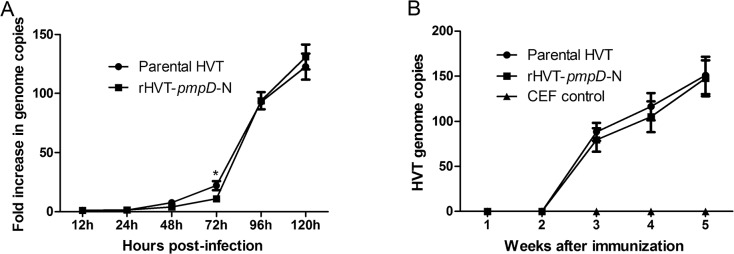
Fig 2. One-step growth kinetics of rHVT-pmpD-N and parental HVT in vitro and in vivo.

(A) The virus growth was calculated as the fold increase at different time points compared with the 12th h post infection. The asterisk indicates significant differences of the growth kinetics between rHVT-pmpD-N and parental HVT (P<0.05). (B) The replication kinetics of parental HVT (n = 10) and rHVT-pmpD-N (n = 15) in vaccinated chickens was evaluated by real time PCR in PBLs. The HVT genome copies were quantified in 75 ng extracted DNA at different time point. The values were shown as means ± standard deviation.
