
Fig 3. Dose-response curves for inhibition of glucose uptake by PfHT and GLUT1.
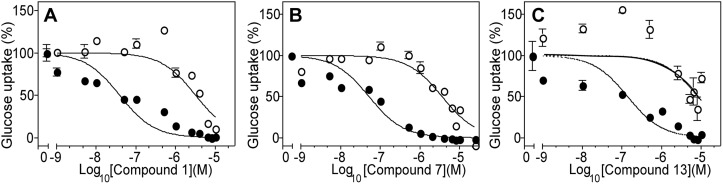
Compounds 1 (A), 7 (B), and 13 (C) were applied over a range from 10-9–10-5 M to Δlmxgt1-3 null mutants expressing either PfHT (filled circles) or GLUT1 (open circles), and uptake of 100 μM [3H] D-glucose was measured in a 1 min uptake assay. Results are plotted as the mean and standard deviation (error bars) from 3 replicate uptake determinations. Data were fitted to a sigmoidal inhibition curve.