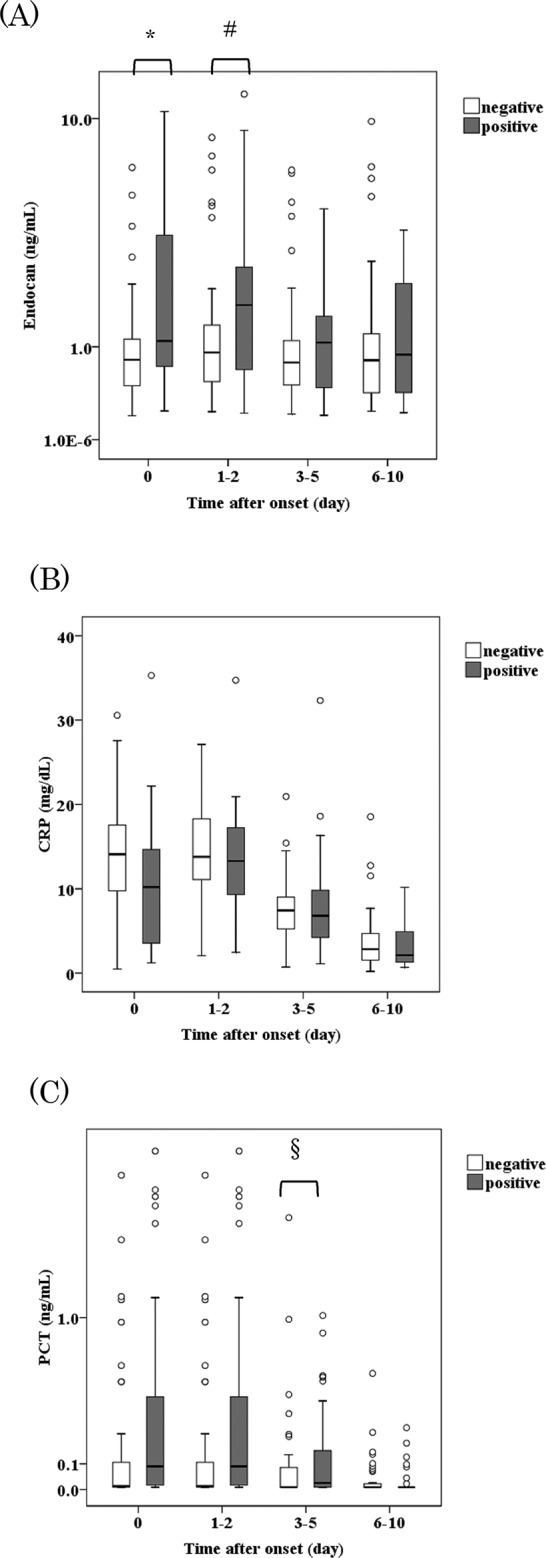
Fig 3. Blood culture positivity and biomarkers during infection.

The boxes represent the interquartile ranges, and the transverse lines in the boxes represent the medians of each group. The vertical lines represent 1.5 of the interquartile range. The circles indicate outliers of each group. The y axes for endocan in (A) and for PCT in (C), but not for CRP in (B) are in log values.* P = 0.003, # P = 0.02, § P = 0.03
