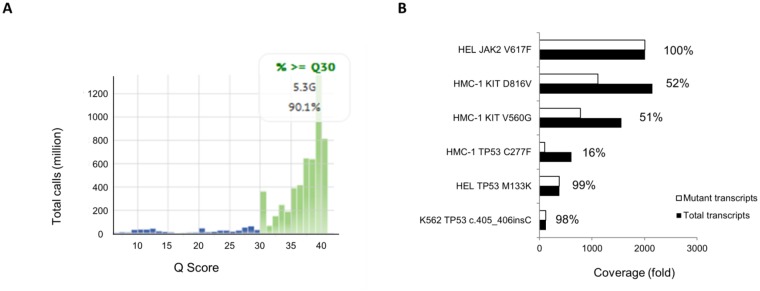
Fig 1. Quality control of next generation sequencing.

(A) Quality of sequencing as assessed by Phred Quality Score (Q-Score) is shown for the second sequencing run, yielding 5.3 GB of data. 90.1% of all bases were called with a Q-Score of 30 or better (indicating that the probability of an incorrect base call was 1:1000 or less). (B) Coverage of wild-type and mutant reads from known mutations in HEL, HMC-1, and K562 cell lines is shown, as analyzed by SeqPilot Software. Percentages display the fraction of mutant reads per total reads in each case, with values close to 100% indicating homozygous and values close to 50% indicating heterozygous mutations.
