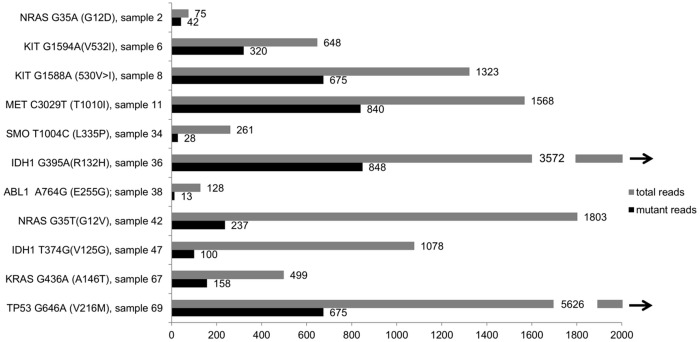
Fig 4. Coverage of detected single nucleotide variations (SNVs).
The y axis shows the detected variant with the base exchange and the resulting amino acid exchange. Furthermore, the sample number is shown. Sample details and clinical data can be extracted from the corresponding sample number in Table 1 (Patient characteristics). The x axis shows the absolute allele burden of mutant reads (grey) and total reads (black) at each SNV site, with the exact numbers shown at the end of the bar. The maximum of x axis was limited to 2000. The black arrows demonstrate that the coverage of these two samples was higher than 2000 (exact numbers given).

