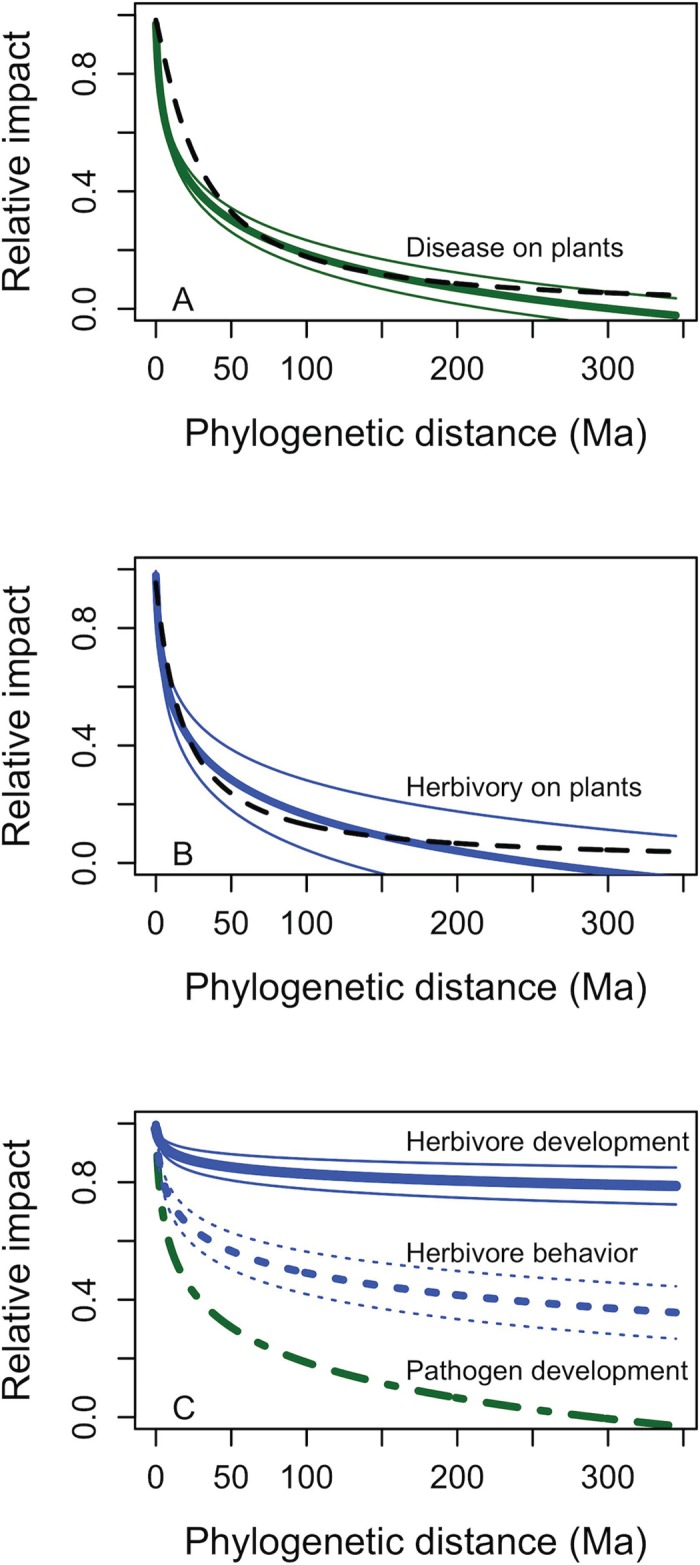
Fig 1. Observed phylogenetic signal in severity of impact of plant-enemy interactions.

Regressions are based on weighted mean regression coefficients of relative impact on the log of the phylogenetic distance between hosts in meta-analysis of published studies. Regression coefficients are given in Table 1. Thick lines are based on mean intercept and slope, and the thin lines are 95% confidence intervals. For comparison in panels A and B, the dashed black lines show the expected probability that two hosts at that phylogenetic distance would share a particular enemy based on re-analysis of data in Gilbert et al. [18], using the present phylogenetic tree. In panel C, Pathogen development has no confidence intervals because it was derived from only one study unit (Table 1, S1 Fig, S1 Table).
