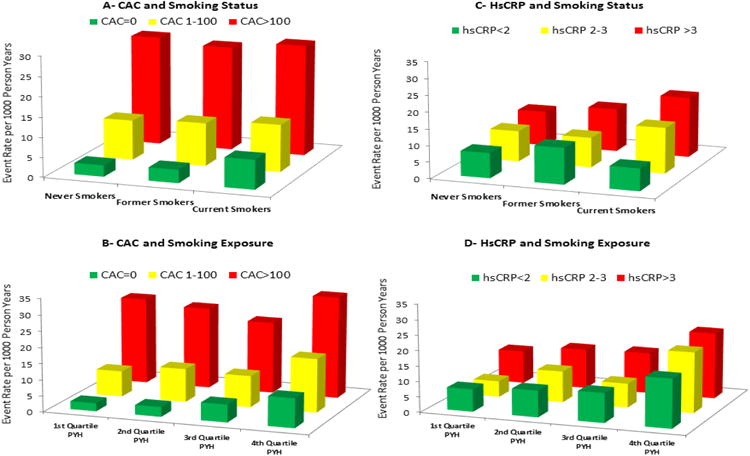
Figure 2. All-cause CVD Incidence Rates (per 1000 person-years) by Smoking Status and Exposure: Stratified by CAC and hsCRP.

A= All-cause CVD by smoking group, stratified by CAC
B= All-cause CVD by quartiles of smoking exposure in pack-years, stratified by CAC
C= All-cause CVD by smoking group, stratified by hsCRP
D= All-cause CVD by quartiles of smoking exposure in pack-years, stratified by hsCRP
CVD=Cardiovascular disease events, CAC=Coronary artery calcium in Agatston Units, hsCRP=high-sensitivity C-Reactive Protein (in milligrams per deciliter), PYH=Pack-year history in Ever-smokers
