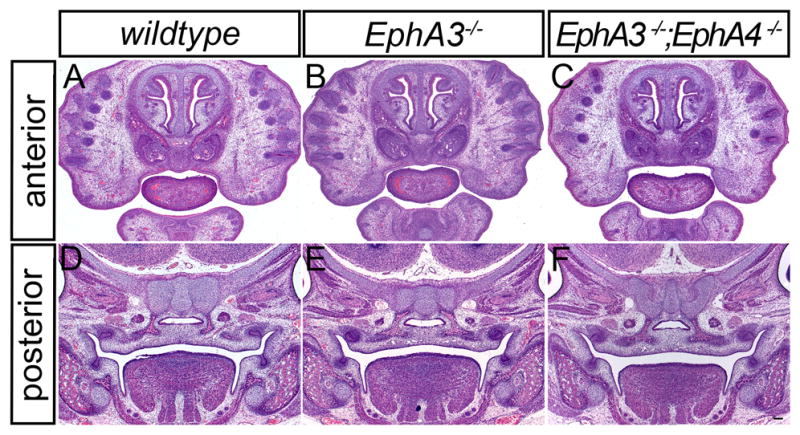
Figure 7.

Histological analysis of EphA3 and EphA4 mutant embryos. Comparison of frontal sections of a wild-type E14.5 embryo (A, D), with EphA3−/− homozygous mutant (B, E) and EphA3−/−; EphA4−/− compound mutant embryos (C, F) shows no overt midfacial phenotype. Scale bar = 100μm.
