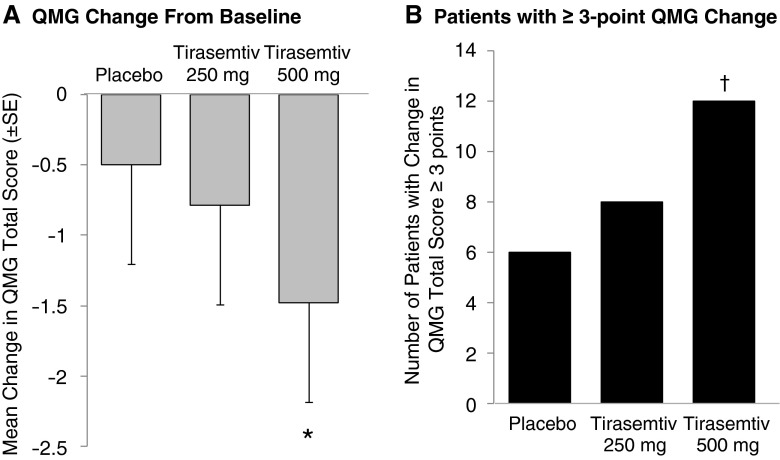
Fig. 1.
Quantitative Myasthenia Gravis (QMG) total scores and patients with change in QMG total score ≥3 points at 6 h after dosing. The (A) least square mean change in QMG total score by treatment and (B) number of patients who achieved a ≥3-point change in QMG total score (indicating clinical improvement) are shown. Error bars represent SE. *p = 0.02 vs placebo; † p = 0.098 vs placebo based on χ2 test

