
Figure 1.
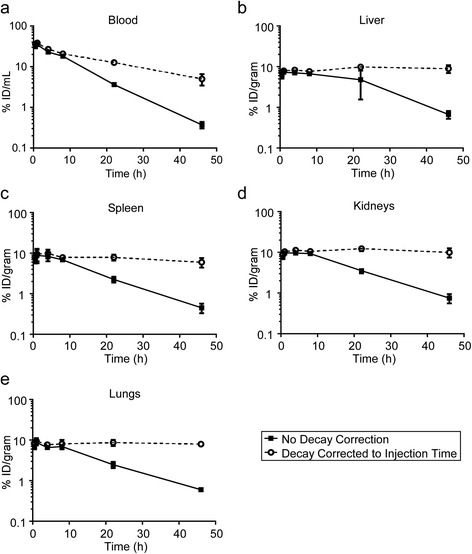
Radiopharmacokinetics of 64Cu-MM-302 in blood and maximum exposed organs of CD-1 mice. Data are expressed as %ID/g for the blood (a), liver (b), spleen (c), kidneys (d), and lungs (e). Data represent the mean ± SD of the three mice. Solid lines indicate data that are not decay corrected, representing 64Cu decay and 64Cu-MM-302 liposome kinetics. Dashed lines represent data that are decay corrected to the time of injection, illustrating the pharmacokinetics of 64Cu-MM-302 liposomes.