
Figure 2.
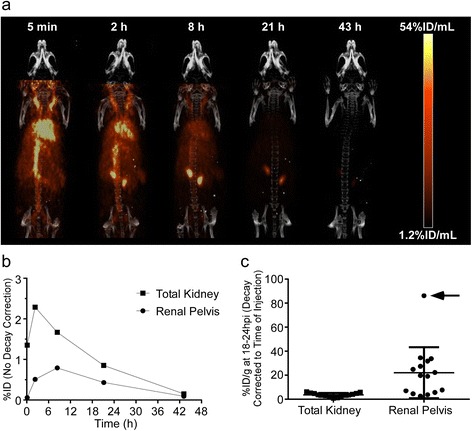
Rodent PET/CT imaging and kidney micro-dosimetry. (a) Maximum intensity projection (MIP) PET imaging time-course of a mouse treated with 64Cu-MM-302. Data are not decay corrected. (b) Time-activity curves of the total kidney (squares) and renal pelvis (circles) generated from the mouse PET images. Data are not decay corrected. (c) Comparison of %ID/g in the total kidney and renal pelvis from mice treated with 64Cu-MM-302 in independent imaging studies. Each data point represents an individual mouse (n = 15). Lines indicate the mean ± SD. The arrow denotes the mouse imaged during the 64Cu-MM-302 dosimetry study. Data are decay corrected to the time of injection.