
Figure 1.
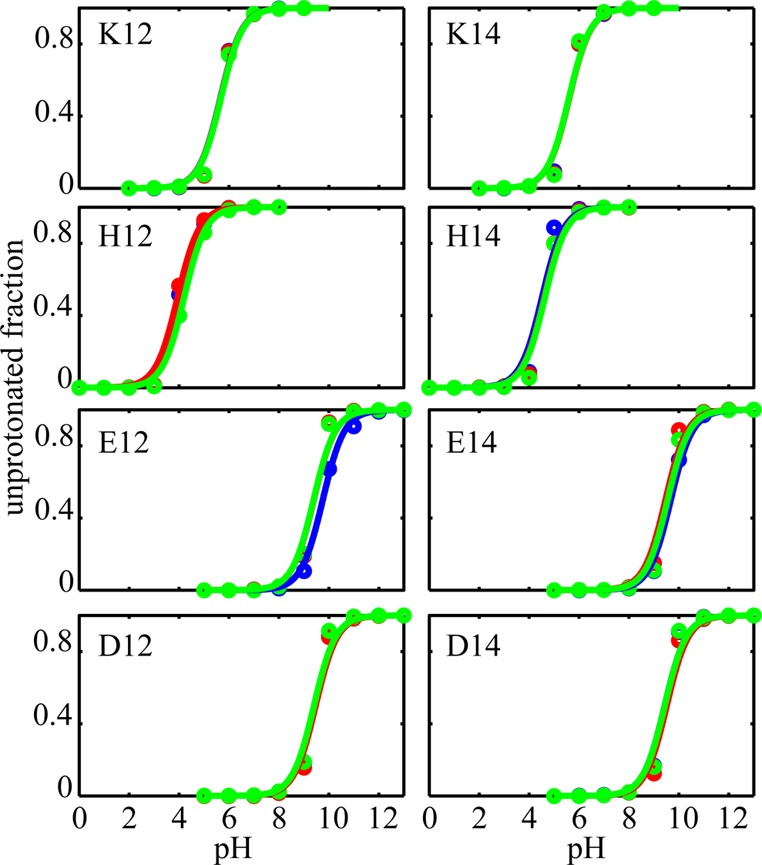
Titration curves for three trials of pH-REX for different peptides listed in Table 1. The unprotonated fractions obtained from pH-REX are shown with circles, and the lines represent the Henderson–Hasselbach fit. In some panels, due to overlap of the curves and data points, only two out of three colors are visible.