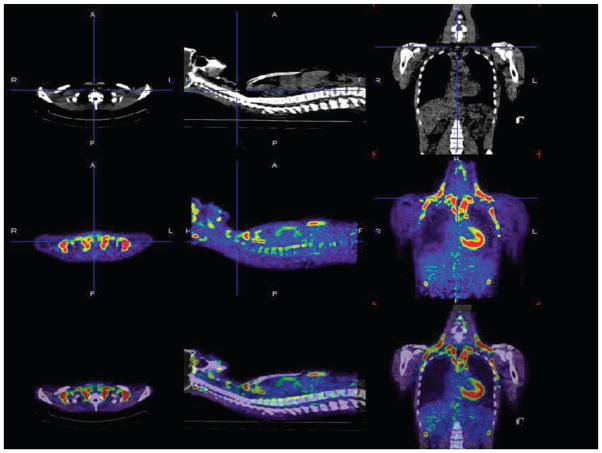
Figure 1.
Anatomical location of discrete brown adipose tissue measured by positron emission tomography (PET). Computed tomography (CT; upper panel ) and PET (with 18F-fluorodeoxyglucose; middle panel ) images from the neck and thoracic region in one lean individual. The bottom panel shows the superimposition of the CT and PET scans. In the three panels (from left to right) are (a) a transverse slice at the level of the clavicles, (b) a sagittal slice at the level of the spine, and (c) a coronal slice of the thorax. Activated brown adipose tissue areas (red and green) are in the cervical-supraclavicular (most common), perirenal/adrenal, and paravertebral regions. Illustration prepared by Dr. Wouter van Marken Lichtenbelt (Maastricht University, The Netherlands).

