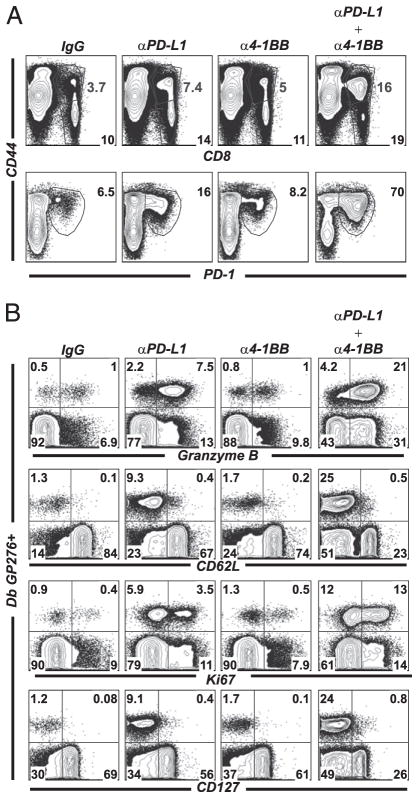
FIGURE 4.
Low dose of 4-1BB stimulation together with PD-L1 blockade results in marked phenotypic and functional differences in LCMV-specific CD8 T cells. Experimental set-up as in Fig. 2A. A, First row, Flow plots are gated on total lymphocytes in spleen. Bottom numbers represent percentage CD8+ T cells within the total lymphocyte population. Top numbers represent the percentage of CD8+ T cells that are activated (CD44hi) within the total lymphocyte population. Second row, Flow plots are gated on CD8 T cells. Numbers indicate the percentage of cells that are PD-1hiCD44hi within the CD8 population (representing total expanded CD8 T cells). B, Granzyme B, CD62L, Ki67, and CD127 expression on Db gp276–286-specific CD8 T cells in spleen. Plots are gated on CD8 T cells. Experiments were repeated at least three times.

