Figure 8.
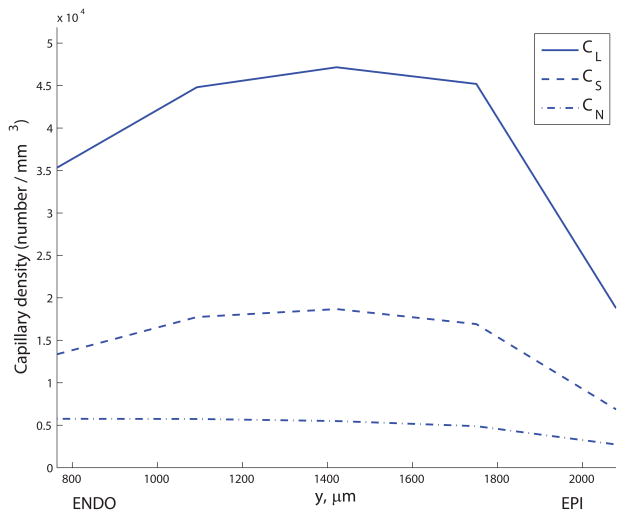
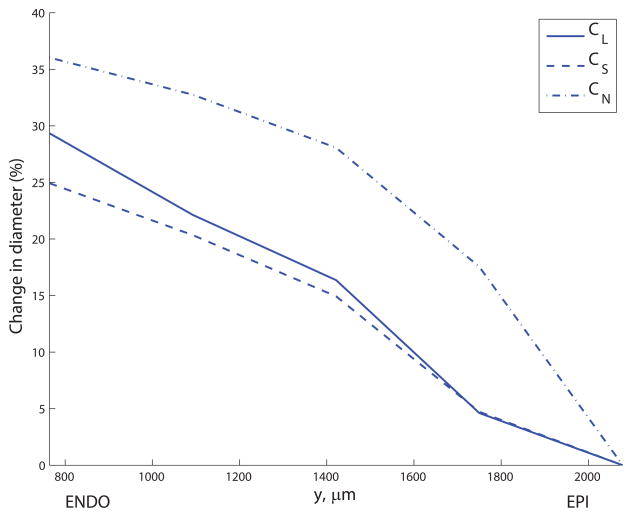
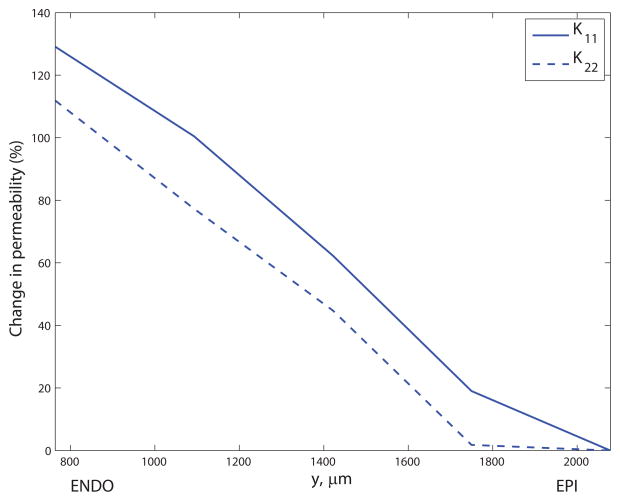
Transmural variation in (a) capillary density (capillaries per mm3) for CL, CS and CN segments; (b) mean diameter (percentage change relative to subepicardial values) for CL, CS and CN segments; and (c) permeability components K11 and K22 (percentage change relative to subepicardial values). The y- coordinate corresponds to the mid-point of the discrete section of capillaries in the data set used to compute the principal axes.


