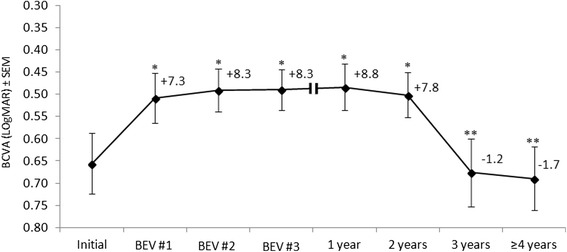
Figure 1.

The mean change in LogMAR visual acuity score (±SEM) during follow-up (n = 75). Mean number of ETDRS letters gained or lost versus baseline visual acuity is shown at each time point. BCVA = best corrected visual acuity; BEV #1, #2, #3 = first, second and third bevacizumab injections, respectively; ETDRS = Early Treatment Diabetic Retinopathy Study; SEM = standard error of the mean. *p < 0.05 vs. initial; **p < 0.05 vs 2 years.
