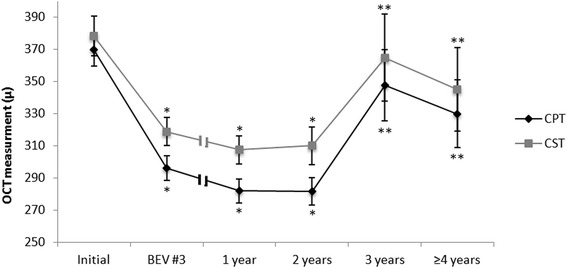
Figure 2.

The mean change (±SEM) in central point thickness (CPT) and central subfield thickness (CST) measurements along the follow up period. BEV #3 = third bevacizumab injection; OCT = optical coherence tomography; *p < 0.05 vs. initial; **p < 0.05 vs. 2 years.
