Figure 2.

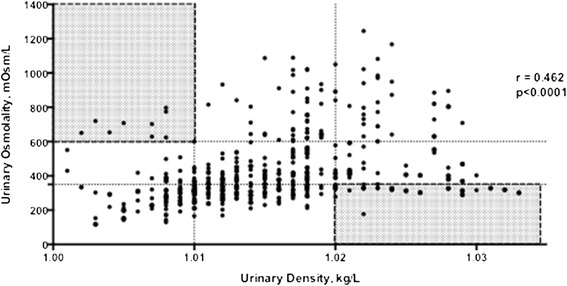
Correlation between urinary osmolality (U osm ) and urinary density (UD) in all groups. Shaded areas are pointing to unexpected high or low UD while Uosm was the opposite.

Correlation between urinary osmolality (U osm ) and urinary density (UD) in all groups. Shaded areas are pointing to unexpected high or low UD while Uosm was the opposite.