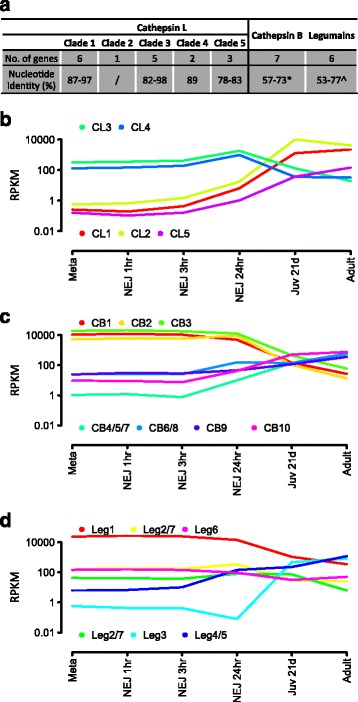
Figure 4.

Analysis of the cysteine proteases belonging to F. hepatica cathepsin L (FhCL) and cathepsin B (FhCB) clades and their activators, the asparaginyl endopeptidases/legumains. (a) Representation of the number of genes identified for each FhCL clade and for the groups of FhCB and legumain genes, based on analysis by BLAST and manual annotation. The nucleotide identity is shown for each clade/group of genes (Clustal Omega). (b, c, d) Graphical representation of the expression for FhCL, FhCB and legumain proteases across the F. hepatica lifecycle in reads per kilobase per million (RPKM). In the case of the FhCL gene expression, all the genes within the same clade showed a similar pattern of expression, and so are represented here as an average log RPKM. Likewise in the case where multiple gene models were identified for a particular gene, which showed a similar level of expression, are represented here as an average log RPKM.
