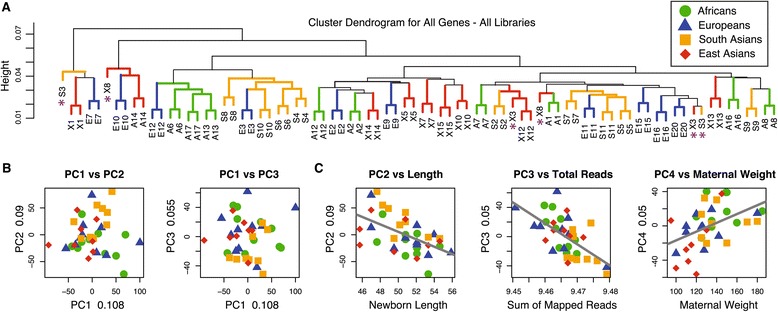
Figure 1.

Overview of total gene expression variation at 13156 expressed genes. (A) A cluster dendrogram of libraries based on the following expression distance between each pair of libraries: 1-abs(r), where r is Pearson’s correlation coefficient for expression levels across all genes. Individual libraries and branches are colored to designate their group affiliation; asterisks indicate three pairs of replicate libraries that do not cluster together. (B) Scatter plots of the first three principle components (PC) using data from individuals and all genes. The explained proportion of variation is annotated on each axis. (C) Scatter plots between the first few PCs and correlated explanatory variables.
