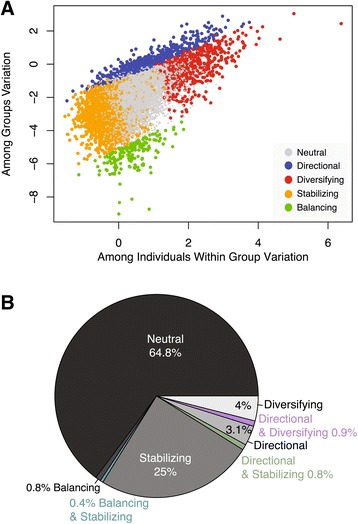
Figure 3.

Evaluating neutral vs. non-neutral evolution of the human placental transcriptome. (A) A scatter plot of among group and among individual variation as measured by the log of the corresponding sum of squares. Genes that were identified as having patterns of variation consistent with neutrality or with directional, diversifying, stabilizing, or balancing selection are color-coded. (B) A pie chart illustrating the proportion of genes consistent with a particular mode of evolution.
