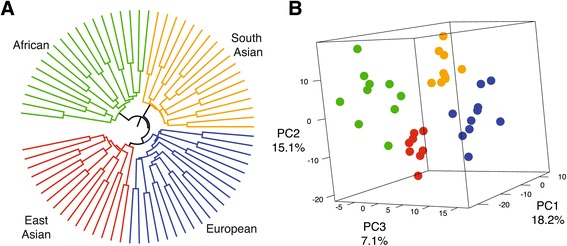
Figure 5.

Population structure revealed by genes consistent with directional selection. (A) A UPGMA tree of expression distances among all libraries and individuals at genes consistent with directional selection. (B) A 3D scatter plot of the first three PCs based on variation in the 646 genes consistent with directional selection. The proportion of explained variation is annotated on each axis and each individual’s group affiliation is color-coded to match the annotation in (A).
