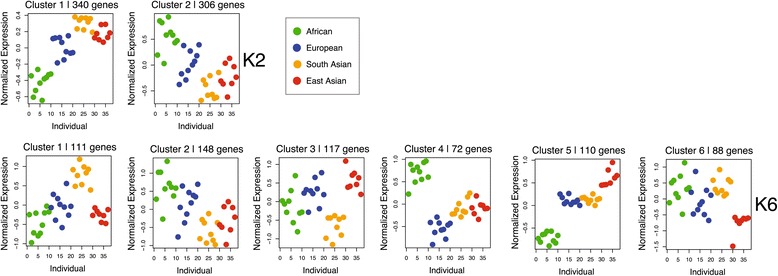
Figure 7.

Expression levels for genes consistent with directional selection. Each dot represents an individual spaced across the x-axis and with mean normalized gene expression on the y-axis. The results of the cluster analysis are illustrated for two clusters (K2) and for six clusters (K6). Individuals are color-coded with respect to their associated group.
