Figure 8.

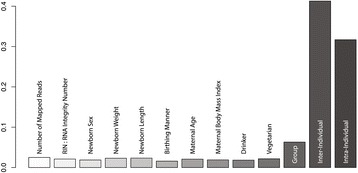
Apportionment bar plot. Each gene was fit to a single model accounting for 13 explanatory variables and the proportion of variation explained by each variable was estimated using the sum of squares approach.

Apportionment bar plot. Each gene was fit to a single model accounting for 13 explanatory variables and the proportion of variation explained by each variable was estimated using the sum of squares approach.