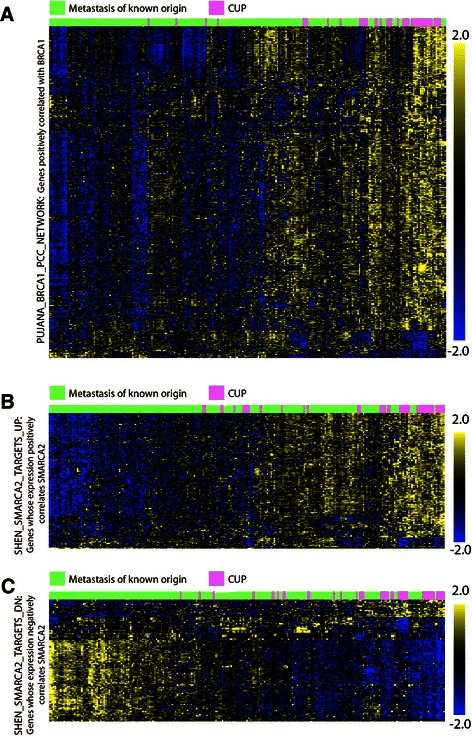
Figure 4.

Two way hierachial clusters of BRCA1 and SMARCA2 networks in metastases and CUP. (A) The PUJANA_BRCA1_PCC_NETWORK was downloaded from the MSig database (http://www.broadinstitute.org/gsea/msigdb) and used to generate a paired two way hierarchical cluster with known metastases and CUPs. Gene symbols were translated into probe sets and because of the probe set redundancy the data were filtered by a p < 0.001 before clustering. Following filtering 1297 probe sets were included in the clustering. Known metastases are indicated in green and CUP samples are labeled with pink above the cluster. The scale is shown at the right side of the cluster. (B) Two-way cluster of the SHEN_SMARCA2_ TARGETS up- and (C) downregulated transcripts. The sets consists of 360 down- and 430 up-regulated genes that translated into 772 and 1211 probe sets, respectively. The known metastases are indicated in pink and CUP samples are labeled with green below the cluster. The scale is shown at the right side of the cluster.
