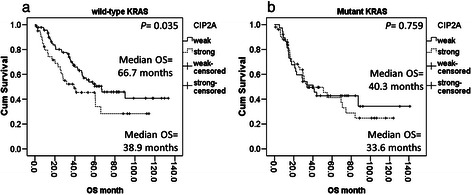
Figure 3.

Kaplan–Meier survival plot of overall survival (OS) by KRAS genotype. (a) OS was significantly worse in patients with wild type KRAS and strong CIP2A expression, compared with patients with wild type KRAS and weak CIP2A expression (P = 0.035). (b) No difference in OS associated with CIP2A expression was observed in mutant KRAS patients (P = 0.759).
