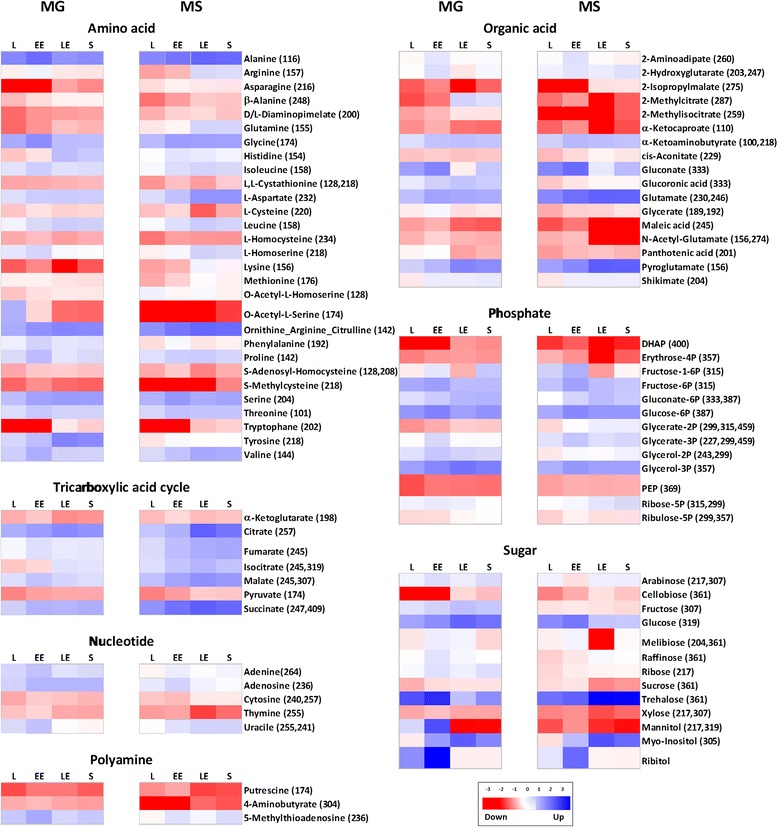
Figure 2.

Metabolite profile of X. dendrorhous. For each metabolite in glucose (MG) or succinate (MS), the response ratio was normalized to Log2. The m/z values of selected ions used for quantification are shown in parentheses. Each column graphic represents the growth phases studied. L: lag, EE: early exponential, LE: late exponential, S: stationary. Red or blue color indicates that the metabolite content is decreased or increased, respectively. Metabolites were grouped according to the KEGG database. Abbreviations: TCA: Tricarboxylic acid cycle, DHAP: dihydroxyacetone phosphate, PEP: phosphoenolpyruvate.
