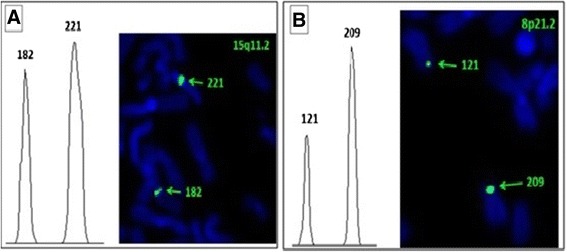
Figure 3.

Sample of evaluation of signal intensities by Scion Image program (highlighted by arrows). Signals intensities measurements were done on homologous chromosomes of 15q11.2 (A) and 8p21.2 (B) after incubation with AFB1 in a. u. CNV-specific BAC probes RP11- 79C23 for chromosome region 15q11.2 and RP11-115K10 for chromosome region 8p21.2 were applied.
