
Figure 2.
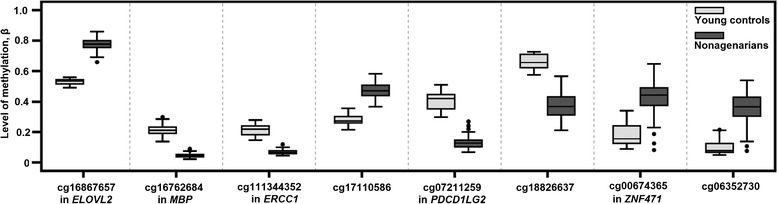
The top ageing-associated CpG sites. The level of DNA methylation presented as a box plot in the control and nonagenarian groups and in CpG sites with the strongest association to age group (cg16867657 (ELOVL2), cg16762684 (MBP), cg111344352 (ERCC1) and cg17110586) and in CpG sites with the largest methylation differences (cg07211259 (PDCD1LG2), cg18826637, cg00674365 (ZNF471) and cg06352730). Gene annotation is shown where applicable. See also Tables 1 and 2.