Figure 2.

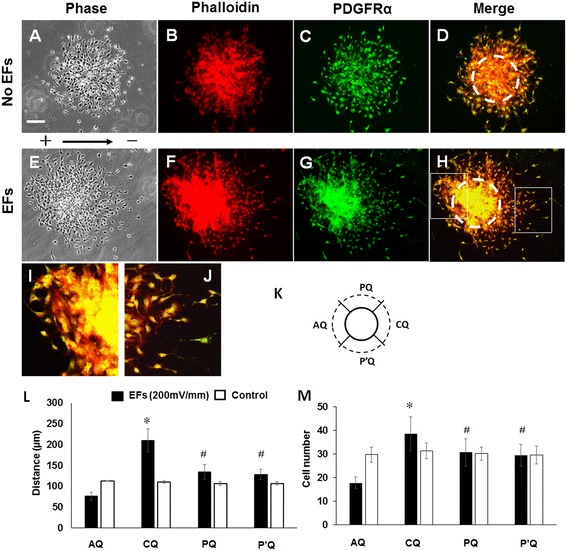
Analysis of cell migration from oligospheres. (A-D) Symmetrical distribution of ARPC2+/+ neural stem cell-derived oligodendrocyte precursor cells (NSC-OPCs) around oligosphere without electric field (EF) stimulation. (E-H) Asymmetrical distribution of NSC-OPCs around oligosphere exposed to EF for 8 hours. Dashed cycle lines in (D) and (H) show core area of oligospheres. (B, F) Cells labeled with rhodamine phalloidin (red). (C, G) Cells labeled with anti-platelet-derived growth factor receptor alpha (anti-PDGFRα) antibody (green). (D) Overlaid images of (B) and (C). (H) Overlaid images of (F) and (G). Scale bar: 100 μm. (I, J) Magnified images of inset indicated in (D) and (H), respectively. (K) Diagram showing division of quadrants around oligosphere. CQ is cathode-facing quadrant. AQ is anode-facing quadrant. PQ and P′Q are quadrants perpendicular to field line of EFs. Solid circle line represents edge of oligosphere core. Dashed circle line represents frontier of migrated cells. (L) Analysis of cell migration distance from oligospheres. (M) Analysis of the number of migrated cells from oligospheres. *P <0.01, compared with anode-facing quadrant and quadrants perpendicular to field line of EFs. # P <0.01, compared with anode-facing quadrant.
