Figure 5.

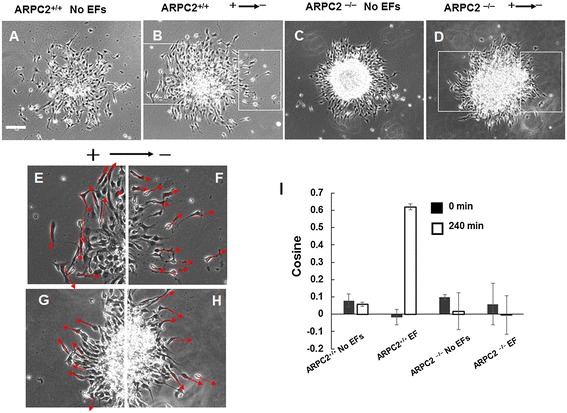
Orientation of cells in electric fields (EFs). (A) Random orientation of leading processes of ARPC2+/+ neural stem cell-derived oligodendrocyte precursor cells (NSC-OPCs) without EF stimulation. (B) Cathode-facing orientation of leading processes of ARPC2+/+ NSC-OPCs in EF of 200 mV/mm for 2 hours. (C, D) Random orientation of leading processes of ARPC2−/− OPCs without EF stimulation or in EF of 200 mV/mm for 2 hours, respectively. Scale bar: 100 μm. (E, F) Magnified images of inset indicated in (B). (G, H) Magnified images of insets indicated in (D). Arrows show orientation of leading processes. (I) Quantification of leading processes.
