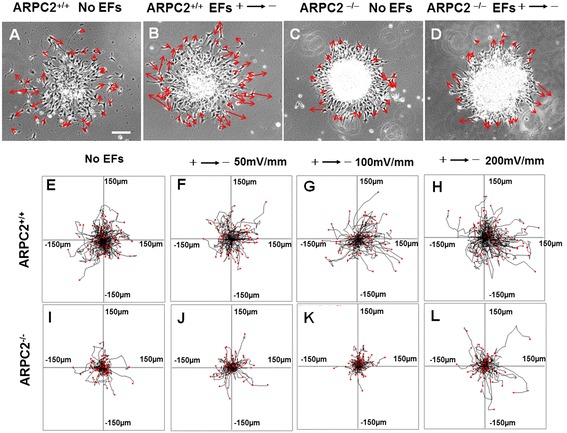
Figure 6.

Migration of neural stem cell-derived oligodendrocyte precursor cells (NSC-OPCs) in electric fields (EFs). (A) Random migration of ARPC2+/+ NSC-OPCs during 2-hour period without EF stimulation. See also Additional file 2: Video 2. (B) ARPC2+/+ NSC-OPC migration to cathode in EF. See also Additional file 4: Video 4. (C) Random migration of ARPC2−/− NSC-OPCs during 2-hour period without EF stimulation. See also Additional file 3: Video 3. (D) Random migration of ARPC2−/− OPCs in EF. See also Additional file 5: Video 5. Arrows show migration direction and positions of cells at beginning and end of each experiment. Scale bar: 100 μm. (E-L) Migration paths of cells determined by video monitor tracings. Position of all cells at t = 0 minutes is represented by origin position (center of frame) with migratory track of each cell at 120 minutes plotted as single line on graph. Each arm of axes represents 150 μm of translocation distance.
