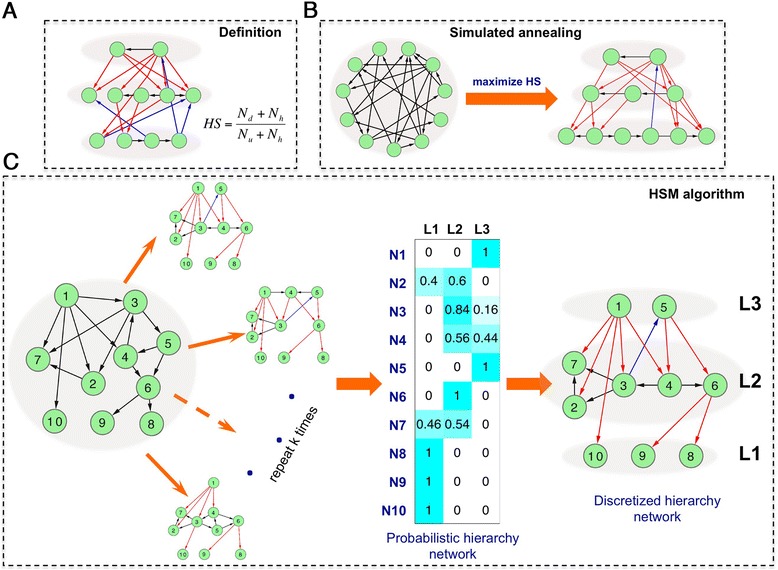
Figure 1.

The schematic diagram of the hierarchy score maximization algorithm. In hierarchical networks, the downward, upward, and horizontal edges are shown in red, blue, and black colors, respectively. (A) The definition of hierarchy score. (B) A simulated annealing algorithm for inferring the hierarchical structure by maximizing the hierarchy score. (C) The procedure to calculate the probability of nodes in different hierarchy levels. Simulated annealing procedure is performed for k runs and in each run a hierarchical structure is inferred by maximizing the hierarchy score. The frequency of each node in these k hierarchical networks is calculated to obtain a probabilistic hierarchical network. Discretized hierarchical network is obtained by assigning nodes to the level with highest frequency.
