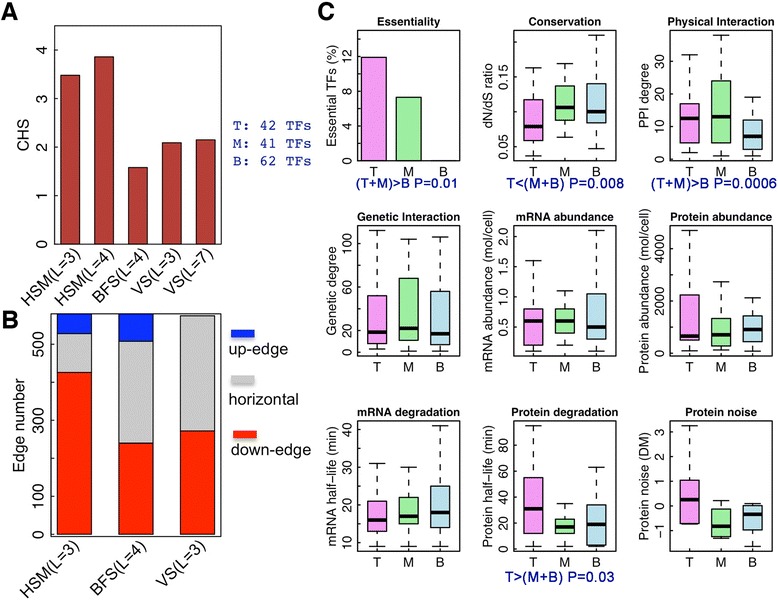
Figure 4.

Application of HSM algorithm to the yeast regulome. (A) The corrected hierarchy scores for hierarchical networks as inferred by HSM, BFS and VS methods. (B) The number of downward, upward, and horizontal edges in hierarchical networks inferred by the three methods. (C) The correlation of TF properties with hierarchy. T, M, and B represent top, middle, and bottom levels, respectively.
