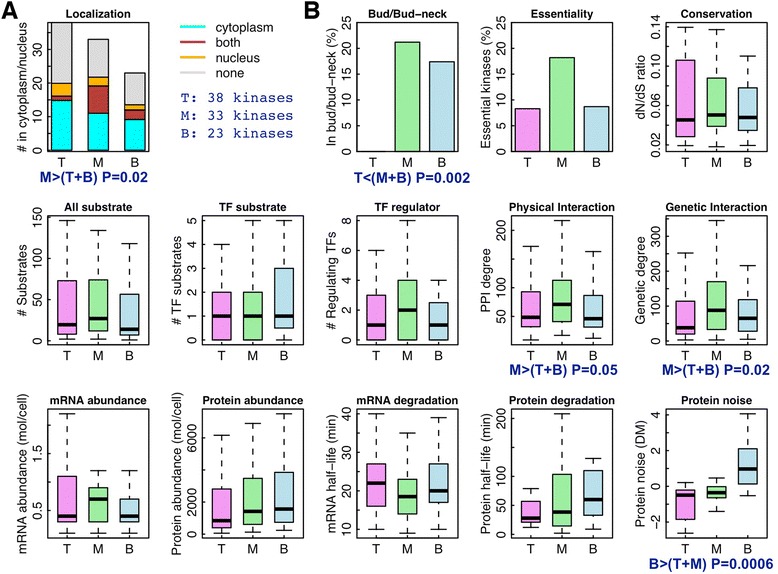
Figure 5.

Application of the HSM algorithm to the yeast phosphorylome. (A) The localization of kinases at different levels in the cytoplasm and nucleus. (B) The correlation of kinase properties with hierarchy. T, M, and B represent top, middle, and bottom levels, respectively.
