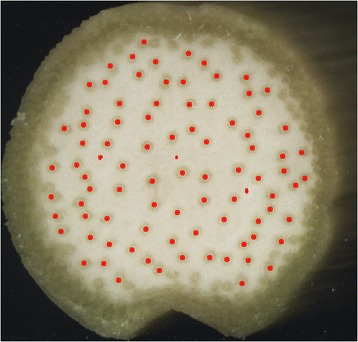
Figure 5.

Vascular bundle localization. The position of each peak in grayscale value detected after the filtering step shown in Figure 4 is projected on to the original image and labeled in red. At this stage, the user may choose to select bundles not detected by the program.
