
Figure 8.
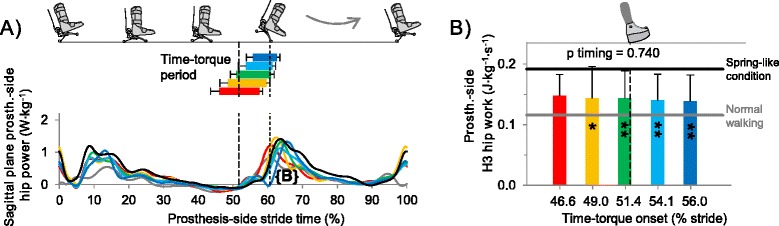
Hip joint power and work. (A) Prosthesis-side hip power. (B) Prosthesis-side hip positive work during swing initiation (H3, 50-90% stride). Bar and curve colors correspond to Time-torque onsets. Black line is Spring-like condition. Gray line is Normal Walking. Horizontal bars indicate Time-torque period. Vertical dashed lines represent mean timing of intact-side heel contact and prosthesis toe off. Error bars are inter-subject standard deviations. P-values are from repeated measures ANOVA on timing bins. Symbols inside bars represent significant differences versus Spring-like condition. ** = p ≤ 0.01, * = p ≤ 0.05, t = p ≤ 0.1.