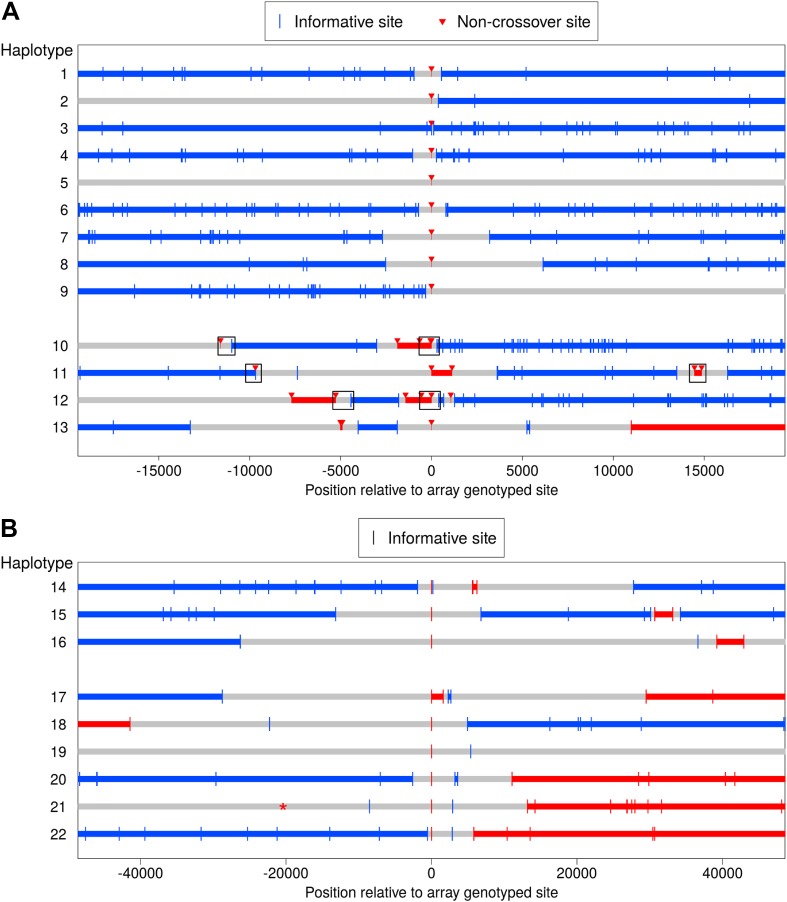
Figure 4. Clustered non-crossover events evident in resequencing and SNP array data.
(A) Recombination patterns in whole genome sequence data for the region surrounding 13 NCO events originally identified in the SNP array data. Each horizontal line represents a haplotype transmission from a single meiosis, and position 0 on the x-axis corresponds to NCO sites identified in the SNP array data. Blue lines depict haplotype segments that derive from the parental homolog transmitted in the wider surrounding region, with blue vertical bars depicting informative sites. Red lines depict segments from the opposite homolog and are putative NCO events, with red arrows indicating informative sites. Grey lines are regions that have ambiguous haplotypic origin. For haplotypes 1–9, only a single site exhibits NCO. For haplotypes 10–13, several NCO sites appear in a short interval near each other but separated by informative SNPs from the background haplotype. Boxes indicate regions for which we preformed Sanger sequencing (see text). (B) Clustered recombination events identified in the SNP array data; note the different scale on the x-axis compared with panel A. Here, haplotypes 14–16 are clustered NCO events while haplotypes 17–22 occur near but not contiguous with CO events (note the switch in haplotype color between the left and right side of the plot). It is uncertain whether the alleles descending from the blue or the red haplotype represent NCO events (‘Materials and methods’—‘Inclusion criteria’); thus the plot uses the same symbol for informative sites from both parental haplotypes. Haplotype 19 also appears to have resulted from a CO, but with informative sites more distant than the range of the plot. Haplotype 21 contains an informative marker that has ambiguous phase in the third generation and therefore was not detected initially, but it is plotted here with a * symbol. The ambiguous phase in the third generation is consistent with neighboring sites and not indicative of an incorrect genotype call.

